The U.S. economy posted strong growth with fourth quarter 2017 Real Gross Domestic Product (real GDP) growth revised upwards to 2.9 percent. Inflation is inching up to the Federal Reserve target. With 103,000 jobs added in March, the economy has added jobs for the 90th consecutive month. The 30-year fixed-rate mortgage has hovered around the 4.4 percent mark since mid-February.

While housing inventory is still tight, we expect the increased construction of new homes to help reduce the pressure on house price appreciation, which is currently at an annual rate of around seven percent. Home sales are holding up despite the increase in mortgage rates compared to last year. Will home sales maintain momentum? What are the factors which could drive sales this year and next?

Home sales

Home sales have been recovering since 2010 (Exhibit 1). Total home sales (the sum of new and existing home sales) have increased each year since 2010, with 2014 the lone exception largely due to higher mortgage rates. But higher rates don’t necessarily mean home sales will slow. From 2016 to 2017, home sales rose with mortgage rates.

Home sales depend on the interaction between demand- and supply-side factors. Factors influencing housing demand include demographic forces, labor market outcomes and financing conditions, including mortgage rates and the availability of credit. Housing supply factors include the construction of new homes, vacancy rates and the inventory of existing homes for sale.

The inventory of existing homes for sale is linked to housing demand because, in many cases, sellers of existing homes are also home buyers. This dynamic is important for understanding current housing supply.

Demand for homes

Demographics

The Millennial generation, poised to overtake the Baby Boomers next year as the largest generation, has started to move the housing market. While the Millennials’ rate of household formation is well below that of prior generations, their sheer size should drive demand higher. Baby Boomers are also living longer, healthier lives, extending their homeownership years longer than ever before.

Given population trends, the U.S. should be adding over a million households each year for the next few years. Over time, slower population growth rates should reduce household formation rates. But that reduction is still several years away. There is also substantial pent up demand. The rise of shared living arrangements, multigenerational households and delayed household formation could just reflect the different preferences and priorities of the Millennial generation, but as we documented in our March Insight, we believe that higher housing costs and decreased labor market participation have driven the decline in young adult household formation rates between 2000 and 2016. Even so, young adults will fuel housing demand over the next decade.

Jobs and income

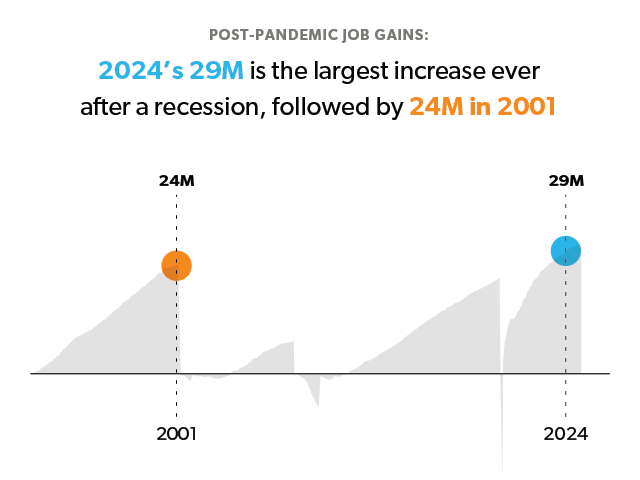
The labor market drives housing demand, as a stronger labor market equates to more jobs and higher incomes. U.S. employers have added 17.9 million jobs since October 2010. In addition, labor force participation has increased while unemployment remains at the lowest level in 17 years.

Income growth is likely to get a boost as a result of recent tax reform. Per the Congressional Budget Office, total salaries are likely to increase by an average of 0.9 percent over the next decade due to the Tax Cuts and Jobs Act. The full effect of the tax reform might not show up until next year as homeowners begin to pay higher taxes due to the reduced deductibility of mortgage interest and property taxes. These changes on the employment and income fronts are likely to boost incomes and have a positive effect on home sales, at least in the short run.

Financing conditions

In recent years, about 80 percent of all home sales are financed with a mortgage. Historically, the share has been about 90 percent. Thus, mortgage financing conditions have a major impact on the demand for homes.

If credit is expensive and tight, housing demand will contract. Alternatively, if credit is cheap and loose, then housing demand will surge. In the current environment, credit conditions remain supportive of housing demand.

Mortgage rates

Higher mortgage rates reduce home sales by increasing the monthly payments required of prospective buyers. For example, on a loan of $250,000 with a 20 percent down payment, an increase in the mortgage rate from 4 to 4.5 percent would increase the monthly payment by $73, or about $900 per year.

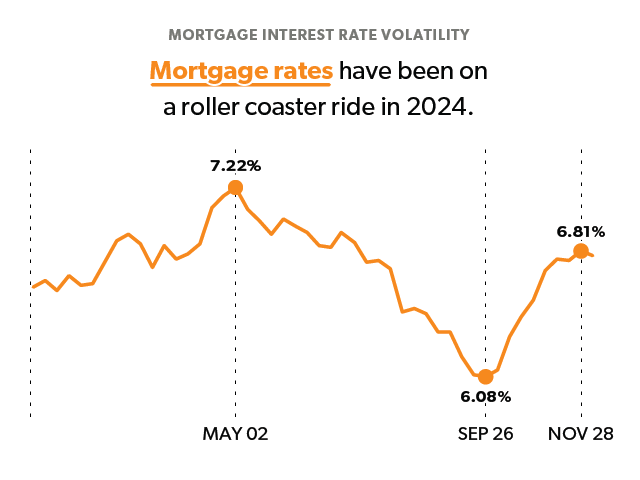
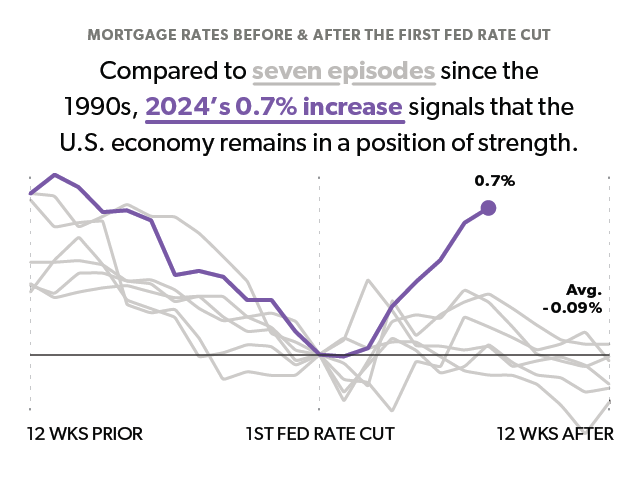
Mortgage rates are up about half of a percentage point since the beginning of the year. If rates continue to rise, that could slow home sales. However, if rates are rising due to a stronger economy, then rising incomes could offset the increase in rates.

Mortgage credit

Credit availability depends on the borrowing capacity and credit worthiness of borrowers, as well as the products and terms offered by lenders. Credit availability has been rising since 2014,1 according to the Mortgage Credit Availability Index (MCAI) of the Mortgage Bankers Association, which measures the availability of mortgage products. The Urban Institute also measures credit availability in their Housing Credit Availability Index (HCAI). Per their analysis, risk remains below their benchmark of reasonable lending standards in the early 2000s, but has increased since 2014.

While there may be room to safely expand credit in the current environment, credit constraints are not the dominant constraint on home sales. The dominant constraint on sales lay on the supply side of the housing market.

Construction

The U.S. economy is not building enough housing units to meet demand. The single-family housing market lags significantly behind both historical averages and our estimates of long-run housing demand (Exhibit 2). Construction has been held back by labor shortages and an increase in development costs since the financial crisis.2 Even as construction has been ramping up recently, it has not been enough to match demand. Housing starts picked up in the third quarter of 2017, which implies that new homes will be available on the market in the coming months. Homes under construction reached new expansion highs of 1.12 million as of March.

Without construction of new homes or a supply of available for-sale vacant homes, the housing market cannot grow.

Vacancy rates

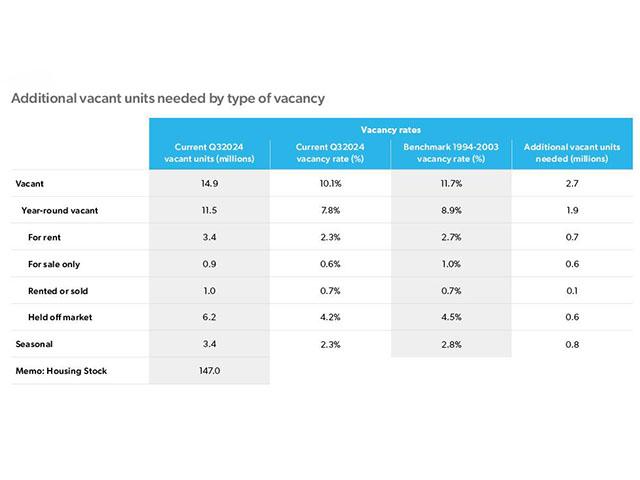
Early in the housing recovery there was a significant overhang of vacant homes. Exhibit 3 shows our estimate of the over/undersupply of vacant homes for the U.S. We compare U.S. Census data on vacant homes to historical average vacancy rates for for-sale and for-rent properties. We construct an estimate of the excess number of vacant units relative to a benchmark based on historical average vacancy rates. During the housing crisis, the number of vacant homes surged above our benchmark, with nearly 2 million excess vacant homes for sale or rent in 2009.

Early in the recovery, as homeownership rates dropped and rental markets surged, excess for-rent vacant homes turned sharply negative, indicating very tight rental markets. In recent quarters, the excess supply of vacant for-sale homes has also turned negative. In the fourth quarter of 2017, there was an undersupply of 600,000 housing units relative to our benchmark.

Without a supply of new or vacant homes, the housing market has difficulty accommodating increased housing demand.

Existing homes for sale inventory

Most home sales are repeat transactions. The existing home sales market is an important source of housing supply. In recent years, the inventory of existing homes for sale has been low and has trended lower. Per estimates by the National Association of Realtors, the number of single-family homes available for sale in the U.S. in February 2018 was just 1.41 million units, less than half of the peak in 2007 (Exhibit 4).

The low level of for-sale single-family homes reflects a tight repeat sales market and presents a conundrum to the housing market. As P.T. Barnum is often quoted as saying, “Nothing draws a crowd like a crowd.” Since most sellers of existing homes are also looking to buy a home, low levels of inventory work to suppress inventory. Existing homeowners who are tempted to list their home may hesitate if they face the prospect of selling their current home rapidly and being unable to find a home to buy.

The increase in mortgage rates may push for-sale inventory even lower. Rising mortgages rates present a double challenge to housing markets. On the demand side, rising rates reduce affordability. But rising rates also may have an important supply-side effect. Current homeowners who purchased or refinanced their home over the past few years may have a mortgage rate well under current rates. If those homeowners were to sell their existing home and buy another with mortgage financing, they would have to pay a higher rate. This interest rate lock-in effect may further depress for-sale home inventory.

With low levels of new home construction, few vacant homes and a dearth of existing homes for sale, supply constraints are holding back the housing market. How does that impact home values?

The effect on home prices

The interaction of housing supply and demand drive house price dynamics. When the supply of homes exceeds demand, prices tend to fall or grow slower. When the demand for homes exceeds supply, prices tend to increase. During the Great Recession, the supply of homes far exceeded demand, vacancy rates soared and house prices collapsed. But in recent years, housing demand has outpaced housing supply and home prices have risen rapidly.

As home prices rise, more and more prospective buyers will find that they cannot afford to buy. But despite several years of home price growth outpacing income growth, the demand for homes has remained robust. Recent house price metrics show continued strong house price appreciation. Modest increases in mortgage rates have not been enough to offset the effects of demographic forces, more jobs and higher incomes.

How it plays out

What then, should we expect for home sales over the next two years?

Our baseline economic forecast has the U.S. economy continuing to grow with gradual increases in interest rates. In this environment, U.S. home sales should post modest growth over the next two years.

We forecast supply to pick up over the next year, whereas demand, while getting a boost this year from tax reform, would start cooling off due to rising mortgage rates. We also forecast inflation to pick up by the end of 2019. To combat rising inflation, we expect the Fed to raise rates in 2018 and 2019. Mortgage rates would follow the 10-year Treasury higher and average 4.9 percent and 5.4 percent in the fourth quarter of 2018 and 2019, respectively.

Under these conditions, we expect total home sales to increase from 6.12 million in 2017 to 6.3 million in 2018, and to 6.44 million in 2019. New home sales will drive the growth. The existing home sales market will likely remain flat under our baseline forecast. For existing home sales, the effect of stronger income growth and other demand-side factors will be roughly balanced by rising rates. New homes sales will drive growth as housing construction keeps grinding higher.

The risks to our home sales forecast are weighted to the downside. Housing construction is unlikely to accelerate much. The existing home sales market has little room for growth with inventories so constrained. Our baseline forecast has only modest increases in mortgage rates. As our historical analysis showed, rapid increases in rates typically dampen housing market activity significantly.

Were mortgage rates to spike to above 5.5 percent for the 30-year mortgage this year, then home sales would likely decline around 10 percent relative to our baseline.

Conclusion

The broader economic environment remains favorable for home sales. But without new home construction and increased housing supply, home sales in the U.S. will have a hard time growing from current levels. If incomes grow and mortgage rate increases are gradual, then the housing market should post modest growth this year and next.

PREPARED BY THE ECONOMIC & HOUSING RESEARCH GROUP

http://www.freddiemac.com/research

Footnotes

  1. A decline in the index indicates tighter lending standards while an increase indicates loosening of credit.
  2. For more on the causes of lean inventory, see our July 2017 Outlook,
    http://www.freddiemac.com/research/outlook/20170726_lean_inventory_of_houses.html.