How Affordability Affects Housing's Spring Season
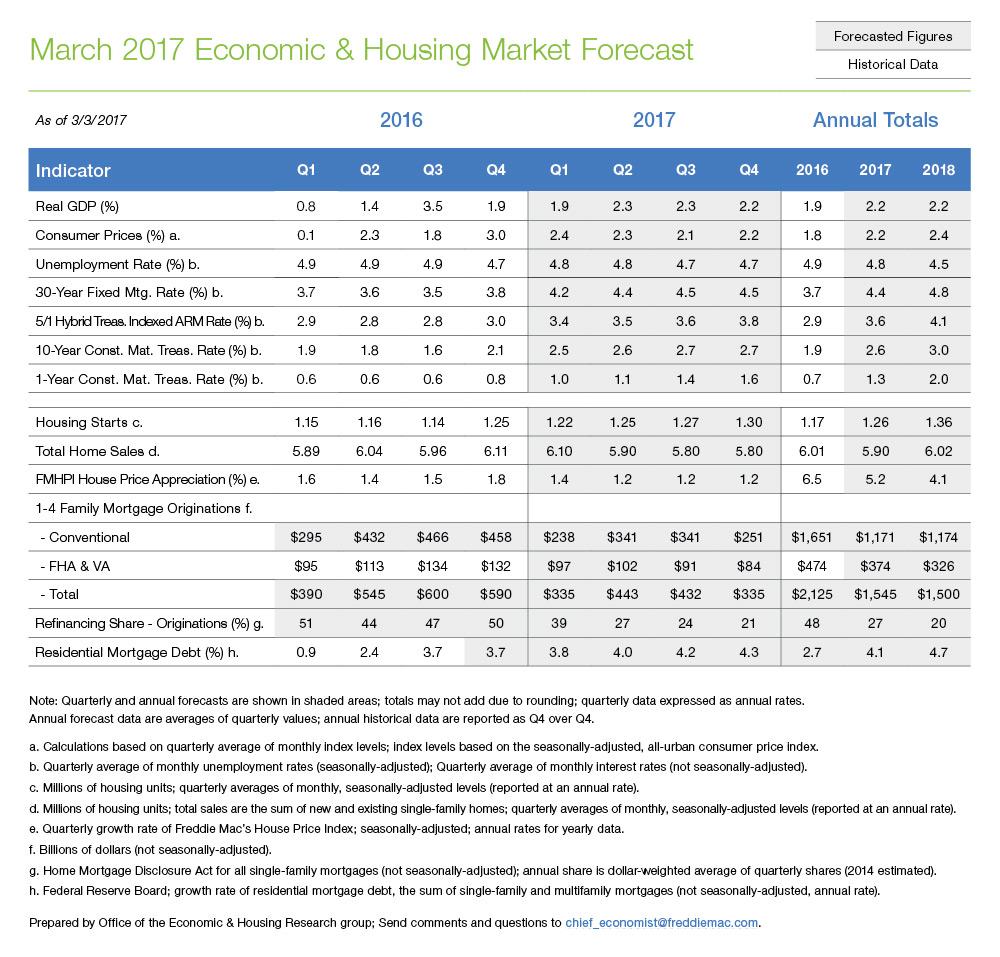
Recent indications of stronger growth convinced the Federal Reserve to raise the Federal funds rate this month and to signal further increases later this year. These Fed actions are unlikely to derail the moderate improvements in growth and employment, but rising interest rates will reduce mortgage originations and put a cap on home sales in 2017.
Recent trends in economic, Housing & mortgage markets
The modest real growth of the last few years appears to be picking up speed. Fourth-quarter real GDP growth for 2016 was an estimated 1.9 percent at a seasonally-adjusted annual rate. However, stubbornly low inflation kept the Fed on the sidelines for most of last year. Recent readings convinced the FOMC to raise rates in March and hint at the possibility of more increases later this year. The Consumer Price Index (CPI) increased 2.7 percent year-over-year this February, up from 1.0 percent year-over-year in February 2016. The most encouraging and persuasive evidence of economic improvement was the strong February employment report. Nonfarm payrolls added 235,000 employees and the unemployment rate dropped slightly to 4.7 percent.
The Housing market posted strong gains in 2016. Total home sales of just over 6 million units marked the largest annual growth in almost 10 years, and mortgage originations reached $2.1 trillion. However, rising mortgage rates will weigh on the market going forward, and mortgage originations will drop a little over 25 percent in 2017, almost exclusively as the result of plummeting refinances. Pent-up demand for the tight supply of houses for sale remains high, and total home sales will end the year at 5.9 million, down slightly from 2016. The persistently tight supply of homes for sale also will continue to prop up house price growth this year.
On homebuyer affordability and home sales
Rising mortgage rates will reduce affordability in 2017. Standard measures of affordability are composed of three ingredients: home prices, interest rates and income. Increased home prices and mortgage rates will decrease affordability and projected income growth will not keep pace.
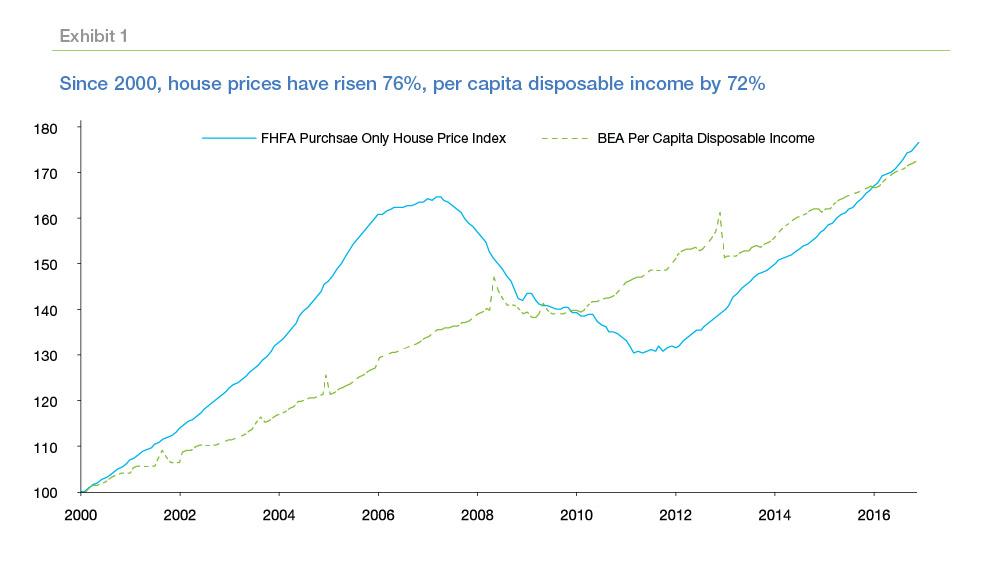
Since January 2000, home prices have risen a bit faster than incomes (Exhibit 1), though recently home price growth has outpaced income growth by a wider margin. From January 2000 to December 2016, home prices, as measured by the FHFA purchase-only house price index, increased 76 percent, while over that time per capita disposable income increased 72 percent.
But house prices have accelerated in recent years while per capita disposable income growth has been more stable. For example, in 2016, house prices rose 6.2 percent while per capita disposable income increased 3.4 percent.
"…mortgage rates have increased about half of a percentage point, and are up more than three- quarters of a percentage"
The 30-year fixed rate mortgage averaged 4.3 percent for the week of March 16, 2017. Compared to a year earlier, mortgage rates have increased about half of a percentage point, and are up more than three-quarters of a percentage point from the lows reached last summer. The most recent period of sustained mortgage interest rate increases was over the spring and summer of 2013, when U.S. weekly average mortgage interest rates for the 30-year fixed-rate mortgage increased by more than a full percentage point from May to September. As we documented late last year, the increase in mortgage rates was associated with a delayed but pronounced contraction in Housing market activity, as existing home sales declined by about ten percentage points following the rate increase.
With home prices outpacing incomes and interest rates headed higher, affordability has declined, putting the pinch on prospective homebuyers. As we get into the spring selling season, we expect affordability to start to bite in many markets pushing some prospective buyers to the sidelines and contributing to a modest decline in total home sales in 2017 relative to 2016.
The most widely cited measure of homebuyer affordability is the National Association of Realtors (NAR) Housing Affordability Index (HAI). The NAR HAI asks whether or not the typical buyer can afford the typical home.1 A value of 100 in the HAI means that the median income family can just afford the median priced home.
As of December 2016, the HAI stood at 162. That means the median income earning family could afford a home priced 62 percent higher than the median sales price of existing single family homes. While the HAI is above 100, indicating homes are generally affordable, it has declined 20 percent since reaching a peak of almost 200 in 2012.
The National Association of Home Builders (NAHB) along with Wells Fargo publishes a Housing Opportunity Index (HOI) that measures the share of recent transactions that a family earning the median family income could afford. While the HAI tells us if the typical family can afford the typical home, the HOI tells us what share of homes in a market a typical family could afford.
Just like with the HAI, the HOI varies substantially across the country, ranging from a high of 90.4 in the Canton-Massillon, Ohio area to a low of 7.8 in the San Francisco-Redwood City-South San Francisco area in the fourth quarter of 2016. This index implies that, depending on which metro area you look at, a family earning the median income could afford as many as nine in 10 homes or as few as one out of 13 homes for sale in their market.
Over the past year as mortgage interest rates and house prices have risen, the HOI has declined. Nationally, the HOI declined 3.4 percentage points from the fourth quarter of 2015 to the fourth quarter of 2016 suggesting declining Housing opportunity. As we approach the spring home buying season for many buyers Housing will be financially out of reach thereby reducing home buying activity in 2017.
Refinance trends
This month we release updated Quarterly Refinance Statistics for the fourth Quarter of 2016 and include metro area statistics for the full year. In the last couple of years, many borrowers already took advantage of the historically low mortgage rates by refinancing into a lower rate mortgage. Refinancing helped borrowers cut their mortgage rate by about 23 percent, or an average interest- rate reduction of 1.1 percentage points. Furthermore, 34 percent of homeowners refinanced into a shorter-term fully amortizing loan, to pay down principal and build home equity faster than on their previous loan.
“Cash-out” borrowers, those who increased their loan balance by at least five percent, represented 45 percent of refinances, the highest rate since the fourth quarter of 2008. An estimated $16.3 billion in net home equity was cashed out during the refinance of conventional, conforming home mortgages, down from $16.5 billion in the third quarter. At its peak, cash-out refinance volume was $84.0 billion (89 percent of total refinances) during the third quarter of 2006.
Every year in the fourth quarter our Quarterly Refinance Statistics also includes refinance statistics for 22 large metropolitan areas. For 2016, median house values on refinance loans rose in all of the 22 large metro areas included in the report, with the highest increases in Denver, Dallas, Houston, San Francisco, Seattle and Miami where home values rose more than 20 percent. The smallest house price increases were registered in Chicago, Philadelphia and Baltimore areas. In metro areas where house price increases were high, the share of “cash-out” borrowers were high as well. For example, in Denver and Dallas metro areas, two areas with the highest increases in house prices, the “cash-out” share was above 50 percent.
PREPARED BY THE ECONOMIC & Housing RESEARCH GROUP
Footnotes
- The way NAR measures the typical home is by the median transaction price for single family homes, while the typical family is represented by one earning the median family income. Then, presuming a family can come up with a down payment of 20 percent and can spend no more than one quarter of their gross income on Housing (Principal and Interest payments) NAR computes a maximum affordable house price for a family earning the median family income. The HAI compares the median house price of recent transactions to the maximum price affordable to a family earning median income.


