We’re halfway through 2017 and macroeconomic conditions are essentially unchanged from the last couple of years. Real growth is moderate, notwithstanding the 1.4 percent reading in the first quarter, though relatively weak growth in the first quarter has been typical for the last couple of years. Inflation remains stubbornly sluggish, leading the Federal Reserve to dampen expectations for another rate hike this Fall. The economy added 222,000 jobs in June, making up for a weak May, while the unemployment rate ticked up a tenth of a percentage point to 4.4 percent. Year-to-date, employment growth has averaged 146,000 jobs per month, similar to the 144,000-monthly average in 2016. 


Table chart of the 2017 forecast, showing macroenomic indicator comparisons


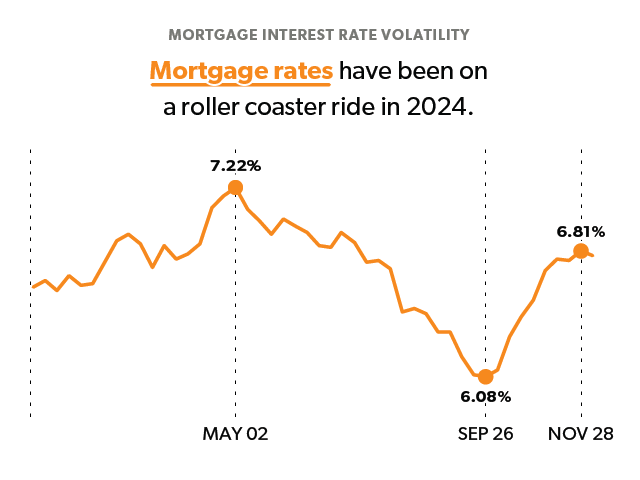
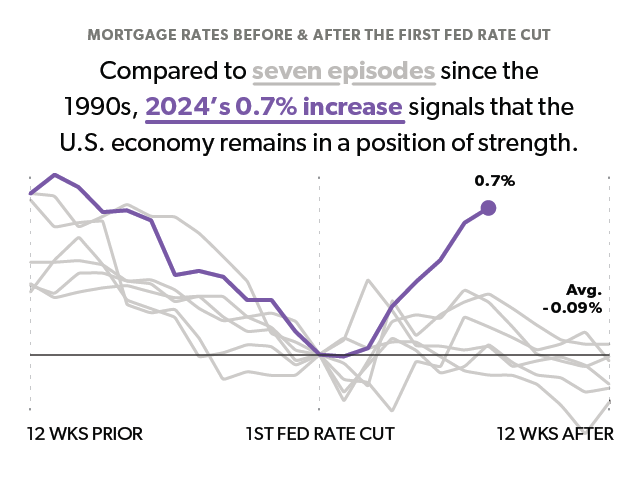
The housing market remains on track for a strong year despite a tight inventory of homes for sale. Home sales bounced back in May after a relatively weak April, and sales year-to-date are running at an annual rate of 5.2 million units, compared to 4.7 million units for the first five months of 2016. Mortgage rates have fallen around 35 basis points since the end of last year and are hovering around 4 percent. At this level, mortgage rates will continue to support robust demand. Housing starts, however, fell 5.5 percent in May and permits for single-family homes fell 1.9 percent. Starts have fallen 14 percent since the end of last year, exacerbating the inventory shortage.

Why aren’t we building enough houses?

A decade after the Great Recession, the housing market is rebounding. House prices today are higher than they were at the peak in the summer of 2006, near-record-low mortgage rates have boosted housing demand, and sales volume is robust. 

The spoiler is the lean inventory of houses for sale. Nationally, just over five months of supply is for sale and hot markets are much tighter than the national average. So far, residential construction is not doing much to fill the gap. Permits as a share of the population dropped around 70 percent during the housing bust and has yet to fully recover (Exhibit 2).


Line graph showing decline in U.S. supply ratio: permits/population from 200 to 2016


With home prices rising and housing demand high, we’d expect builders to increase production.  Instead, they are providing less housing (relative to population) than in the past. The main reasons appear to be a shortage of skilled labor and an increase in development costs.

Tight Labor Market

The number of open construction jobs has been on the rise since the recession. As of May 2017, the number of open construction sector jobs stood at 154,000, at an elevated rate of 2.2 percent of total employment.

Four factors contribute to the current labor shortage in housing: 

  1. The housing collapse in the late 2000s reduced construction employment by 1.5 million.  Many of those who were laid off never returned to the industry, leaving the housing sector with a significant skills gap that will take some time to redress. 
  2. The construction industry is having difficulty attracting younger workers. Traditionally, the construction industry has offered attractive jobs to young people who are either delaying or skipping college. Builders report that fewer young people are interested in these opportunities than in the past.  
  3. While we can’t quantify the impacts, commentators have noted that opioid use is having some negative effect on production. One source estimated that 15 percent of construction workers engaged in illicit drug use and subcontractors report that a significant share of job applicants fail their drug test. 
  4. Increases in the enforcement of immigration laws and a generally less-welcoming environment for immigrants may be reducing the supply of construction workers.   Foreign-born workers have comprised more than a quarter of the construction work force in recent years, and the share has been as high as 35 to 40 percent in states like California, Texas, Nevada, and New York. While it is difficult to quantify, it seems likely that recent policy changes may have made foreign-born workers hesitant to seek employment in construction.

High Development Costs

The price of land (acquisition and preparation for construction) has risen more rapidly than the price of the structures built on the land. This trend has driven up the share of land cost as a proportion of house price (Exhibit 3). Since the cost of land is largely a fixed cost in a building project, the increase in the cost of land tends to make entry-level housing less profitable and thus tilts development toward higher-end housing.


Line graph showing the share of land price in home value from 2000 to 2015


Over the last three decades, land-use regulations have become more burdensome in the U.S., making developable land costlier. As an example, in areas with strict land-use regulation, builders face long delays in obtaining permit approvals (Exhibit 4). In New Orleans, where regulation is relatively lenient, permit approval is received in 3.5 months on average. In Honolulu, where regulations are particularly strict, permit approval takes around 17 months on average. The 2016 White House Report on land use regulation argues that lengthy approval processes have reduced the ability to respond to growing housing demand in many markets.

Map of U.S. showing the approval delay index per state (months)


In cities like San Francisco, the scarcity of buildable land compounds the impact of land use regulations. And, in fact, cities where bodies of water and steep grades significantly reduce the supply of land tend to have stricter-than-average1 land-use regulations.

Table chart showing July 2017 economic and housing market forecast


  • Footnotes
    1. Albert Saiz. 2010. “The Geographic Determinants of Housing Supply.” The Quarterly Journal of Economics. Vol 125. Issue 3. Aug 2010. Pages 1253-1296.